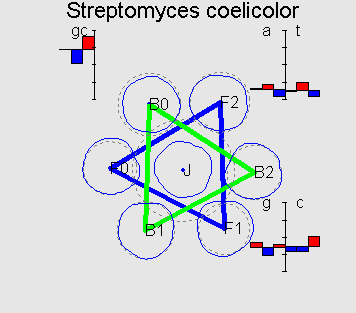
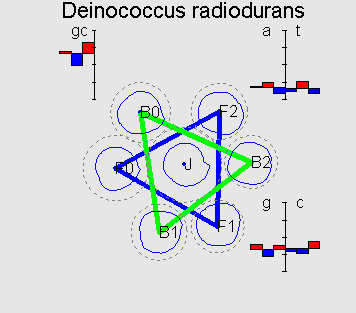
Typical 7-cluster structures Fusobacterium nucleatum parallel triangles G+C=27% Bacillus halodurans perpendicular triangles G+C=44% Ercherichia coli degenerated case G+C=51% Streptomyces coelicolor flower-like G+C=72% |
|
|
|
| 12 - 13 - 23 | rotate - stop | ||
Read our recent paper for more details:
Gorban A., Popova T., Zinovyev A. Four basic symmetry types in the universal 7-cluster structure of 143 complete bacterial genomic sequences. 2004. IHES Preprint. M/04/49.
Characteristic cluster structures of short word distributions
Genomes sequences are highly inhomogeneous texts. One can study this inhomogeneity (non-randomness) by various methods. We think of this problem as detection of cluster structures in spaces of short word frequencies.
Our general setting can be formulated as a science fiction story. Suppose that you live on a planet of robots without any biology known. And suppose that you managed to get bacterial samples from the Earth. You detected presence of a big molecule, rich of information, and it seems that it encodes some information by using four different symbols. How to decipher it? What the robots can learn from the sequence itself?
When studying non-randomness, the robots very quickly will formulate the notion that the information is encoded by non-overlapping triplets. This conclusion will be supported by detecting a beautifull cluster structure in the triplets distributions. We call this structure 7-cluster basic structure and show it on this site for 143 completely known bacterial genomes.
Notion of the higher level 7-cluster structure will allow robots to extract connected pieces of coding information (red in forward and backward direction), i.e, detect genes. They can try to apply the same statistical analysis for this collection again. What do they find? They will find another cluster structure, which we refer to as gene codon usage cluster structure. This is non-randomnes of the second level. On this level the robots will learn that there is a natural scale of triplets, the triplets can be arranged accodingly to the vector connecting two centers of big clusters almost always present in bacterial genomes. Here on Earth, we know this scale as hydrophobicity scale.
This story can be continued. The cluster structure we study have complex hierarchical structure.
To describe local composition of the sequences, we count frequencies of short words. This approach has several advantages in comparison with another very popular HMM (Hidden Markov Modeling) approach.
Firstly, there is a possibility for data visualization facilitating representation of various properties of frequency distributions. Sometimes this is an only adequate method for detecting number and character of clusters or simply regions with higher density in point distributions. In the case of cluster structure study in short word distributions in genetic texts, every cluster corresponds to a state in HMM, whereas density and character of touching with neighbor clusters reflect HMM state transition probabilities. The cluster structure in transition probabilities directly determines capability of corresponding HMM to "learning" and "self-learning".
Secondly, describing local properties of genetic text using "frequency dictionaries" is absolutely independent on HMM method of analysis. It is powerful and universal. Representation of genetic texts using frequency dictionaries allows to solve all principal problems of sequence analysis: gene-finding (see, for example, [1,2]), alignment ([3]), genomes classification ([4]), study information content of DNA ([13]), etc.
On this site we systematically represent two types of cluster structures, revealed in almost all bacterial genomes:
a)7-cluster structure reflecting the fact of compact presence of coding information in bacterial genomes;
b) codon frequency cluster structure, reflecting codon bias phenomenon and inhomogeneity in gene codon usage.
These two cluster structures, hierarchically related, explain most of inhomogeneity in bacterial genetic texts.
We also present various ways of "global" representations of 143 completely sequenced bacterial genomes using simple graphs and PCA plots. This "cartography" of complete genomes highlights various properties of their organisms, including growth (fast- and slow-growers), peculiarities of methabolic pathways as well as inter-organisms interference: phylogenetic (evolutionary) relations, transfer of genes from one genome to another.
7-cluster structure
This structure reflects universal property of genetic texts, containing protein-coding genes: if one counts word frequencies (of length 1-8) in a sliding window of length comparable with average gene length (300-400bp) starting from every third position of the window then resulting distribution of word frequencies will have 7-cluster structure, accordingly to 6 possible reading frames and non-coding regions.
Let us decipher the above described. We represent genetic texts in
the form of point distributions in ![]() -dimensional space, where
-dimensional space, where
![]() is word length
is word length ![]() for our illustrations). Every point
for our illustrations). Every point
![]() corresponds to the distribution of
corresponds to the distribution of ![]() -mer frequencies in
the window of length
-mer frequencies in
the window of length ![]() , opened in position
, opened in position ![]() . The
. The
![]() -mer frequencies are counted in every third position in the
window (see Methods section). In the literature it is known
as frequencies of in-phase oligomers.
-mer frequencies are counted in every third position in the
window (see Methods section). In the literature it is known
as frequencies of in-phase oligomers.
The number of clusters in the structure described can be naturally explained. It is interesting to represent mutual positions of clusters which reflects symmetries of codon usage. For details see [5].
Patterns of mutual cluster positions can be naturally classified in several groups. For example, all GC-rich genomes (with GC-content > 0.55), represent a common flower-like pattern. Above we showed one typical example of it (in Methods you can read about the visualization method).
On the picture F0 is a cluster corresponding to the coding information in forward strand in the correct reading frame; F1 and F2 correspond to a frameshift on 1 and 2bp respectively; B0 is a cluster corresponding to the coding information in backward strand; B1 and B2 are denoted analogously.
On the diagrams 12 position-specific frequencies of nucleotides in
codon usage of the genome are shown as well as position-specific
GC-content. The frequencies are shown as deviations from average
(over all three positions). Flower-like structure of GC-rich
genomes can be explained by a typical values (signature) of
position-specific GC-content (which, in GC-rich genomes can be
symbolized as ![]() ). Also it is easy to explain the fact that in
64-dimensional space all 7 clusters are situated approximately in
one 2D plane: the flower-like structure is "flat" and the symmetry
axis is co-oriented with the gradient of GC-content function. For
more detailed explanations read [5].
). Also it is easy to explain the fact that in
64-dimensional space all 7 clusters are situated approximately in
one 2D plane: the flower-like structure is "flat" and the symmetry
axis is co-oriented with the gradient of GC-content function. For
more detailed explanations read [5].
In the genomes with GC-content < 0.55 the 7-cluster structure, as usual, is less symmetric and is not flat besides some degenerate cases (see genome of E.coli, for example). For a set of genomes (for example, H.pylori) one can observe flower-like structure which is connected with a different symmetry in codon usage.
Codon usage cluster structure
In the 7-cluster structure described above, one of the clusters (F0) corresponds to the coding information in the "correct" phase. Density distribution inside this cluster depends on two factors: a) noise due to the fact that a window can contain both coding and non-coding part if it overlaps an exon border; b) non-uniformness in codon usage.
The first factor can be dealt by preliminary extraction of ORFs: regions from start codon to the first occurence of a stop codon in the same reading frame. We do not use this approach in our analysis, since it does not change much in our case, the method loses in its universality and requires completely assembled genome. In the case of simple sliding window with a constant length, ORF extraction is not needed, hence there is no need to have an assembled genome - one can use a collection of 300-500bp length chunks.
The second factor, i.e. non-uniformness of codon usage is more interesting. It explains the second level in statistical heterogeneity of genetic text: codon frequency which is used to encode a particular protein can vary essentially. In particuler, the codon bias phenomenon takes place: in some genes particular codons are not used or used with essentially smaller frequency than the average over the whole set of genes. In bacterial and some eukaryotic organisms (including drosophila) codon usage can in such a way regulate gene expression level during translation. The codon bias phenomenon is particularly expressed in the genomes of fast-growing organisms, where there exists an evolutionary pressure on their codon usage related to the necessity of fast production of certain protein types like ribosomal proteins.
On this site we systematically present the results ofPCA analysis
for 143 completely known genomes. Every genome is represented as a
cloud of points in 64-dimensional space whee every point ![]() corresponds to the codon usage of a gene,
corresponds to the codon usage of a gene, ![]() ,
, ![]() is a
number of annotated genes including hypothetical ones. Such kind
of analysis is performed in a large number of works (for example,
[]).
is a
number of annotated genes including hypothetical ones. Such kind
of analysis is performed in a large number of works (for example,
[]).
The codon usage cluster structer reflects the thin structure or zooms the F0-cluster without considering noise factor. The same structure is repeateed in all other clusters with an exception of J.
Consequently, this is the next hierarchical level, explaining heterogenuity of genetic text. In this case the cluster structures for different genomescan be grouped in several "group patterns" as well. For fast-growing bacteria (here is the well-known example, genome of E.Coli) there is a characteristic 4-clusters pattern.
Here by red color we mark the genes encoding ribosomal proteins. Their codon usage is an important characteristic of genome ([6]). Cluster 1 coolects most of the genes (68%). Cluster 4 (15%) is clearly separated while clusters 2 (8%) and 3 (9%) look like wings of the cluster 1 and usually not quite well separated from it. The wing 2 can be identified by higher concentration of genes encoding ribosomal proteins. Interestingly, the most of the genes in the wing 3 are annotated as hypothetical or with unknown function. This is a group of genes with homogeneous but "strange" codon usage. In some papers ([7], for example) the genes are assigned with "horizontal transfer" origin. Cluster 4 contains mainly genes encoding proteins with higher concentration of hydrophobic aminoacids. In particular there is an increased concentration of membrane proteins genes there.
Similar structure of heterogenuity is detected with self-training HMMs in [10]. Also some peculiarities of clusters 1-4 are described in [6].
Genomes of slow-growing organisms are less influenced by evolutionary pressure on their codon usage hence the cluster structure is expressed in such a clear manner and the inhomogeneity is explained mainly by continuous change in gene GC-content. Nevertheless some organisms shows a different type of cluster structures (see B.Burgdoferi, for example, see [7,8]).
Implications
a) The 7-cluster structure explains why microbial gene-finders perform so well, in particular self-training methods ([11],[12]);
b) Position of genes in the codon usage cluster structure often allows to predict properties of some proteins (see, for example, [15]).
c) One important application of codon usage cluster structure is an experimental technique of codon optimization ([16]).
d)In fact, any statistical analysis of genetic texts in a way detects first of all the cluster structure described as principal sources of non-randomness and non-homogeneity,
Genome carthography
There exists a big number of papers in which various statistics of genetic texts are used to infer phylogenetic relations between organisms. The statistical properties are used to construct a metrics in which one can measure similarity of two different organisms. The similarities can be represented after in the form of hierarchical trees or in the form of 2D and 3D maps.
This site contains a number of simple maps for 143 complete genomes extracted from Genbank in August, 2004.
The following types of maps are presented:
1) PCA plot of average codon usage;
2) PCA plot of w-values, used in calculation of CAI (see [6]).
- Gorban A., Zinovyev A., Popova T. Seven clusters in genomic triplet distributions. 2003.In Silico Biology. V.3, 0039.
- Zinovyev A. Visualizing the spatial structure of triplet distributions in genetic texts. - IHES Preprint, France. 2002. - M/02/28.
- Sadovsky M.G. The Method to Compare Nucleotide Sequences Based on the Minimum Entropy Principle. Bulletin of Mathematical Biology, March 2003, vol. 65, iss. 2, pp. 309-322(14)
- Analysis of Codon Usage Patterns of Bacterial Genomes Using the Self-Organizing Map (Huai-Chun Wang et al., Mol. Biol. Evol. 18(5):792-800. 2001)
- Gorban A., Popova T., Zinovyev A. Four basic symmetry types in the universal 7-cluster structure of 143 complete bacterial genomic sequences. 2004. IHES Preprint. M/04/49.
- Carbone A., Zinovyev A., Kepes F. Codon Adaptation Index as a measure of dominating codon bias. 2003. Bioinformatics. 19, N13, p.2005-2015.
- Medigue, C., T. Rouxel, P. Vigier, A. Henaut and A. Danchin, (1991). Evidence for horizontal gene transfer in Escherichia coli speciation. Journal of Molecular Biology 222: 851-856.
- Moszer I, Rocha EP, Danchin A. Codon usage and lateral gene transfer in Bacillus subtilis.Curr Opin Microbiol. 1999 Oct;2(5):524-8.
- Daubin V, Lerat E, Perriere G. The source of laterally transferred genes in bacterial genomes. Genome Biol. 2003;4(9):R57
- Nicolas P, Bize L, Muri F, Hoebeke M, Rodolphe F, Ehrlich SD, Prum B, Bessieres P. Mining Bacillus subtilis chromosome heterogeneities using hidden Markov models. Nucleic Acids Res. 2002 Mar 15;30(6):1418-26.
- Audic S, Claverie JM. Self-identification of protein-coding regions in microbial genomes.Proc Natl Acad Sci U S A. 1998 Aug 18;95(17):10026-31.
- Baldi P. On the convergence of a clustering algorithm for protein-coding regions in microbial genomes.Bioinformatics. 2000 Apr;16(4):367-71.
- Gorban AN, Bugaenko NN, Sadovsky MG. Maximum entropy method in analysis of genetic text and measurement of its information content. Open systems and information dynamics. Netherlands, 5, 1998. - pp.265-278.
- Ou HY, Guo FB, Zhang CT. Analysis of nucleotide distribution in the genome of Streptomyces coelicolor A3(2) using the Z curve method. FEBS Lett. 2003 Apr 10;540(1-3):188-94.
- Hua S, Sun Z. Support vector machine approach for protein subcellular localization prediction. Bioinformatics. 2001 Aug;17(8):721-8.
- Fuglsang A. Codon optimizer: a freeware tool for codon optimization. Protein Expr Purif. 2003 Oct;31(2):247-9.