ViDaExpert 1.0
Tool For Multidimensional Data Visualization
(Implementation of the Method of Elastic Maps)
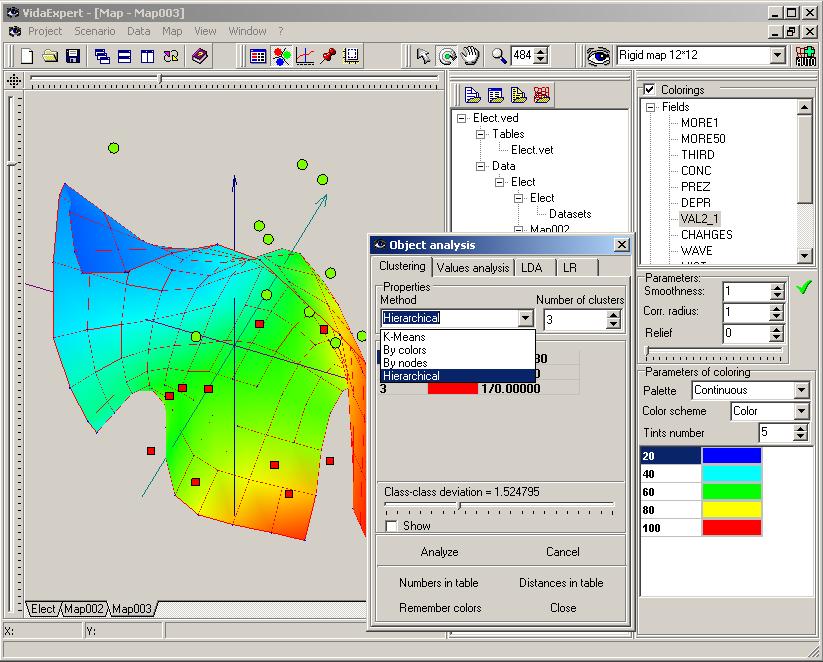
ViDaExpert 1.0 is unique software tool for
visualization of multidimensional datasets.
It allows to
make understandable color illustrations of a dataset to explore it’s intrinsic
patterns and regularities.
The main
technique implemented in ViDaExpert is the Method of Elastic Maps – advanced
analogue of the Method of Self-Organizing Maps. Besides, there are many other
methods of data analysis, including Principal Components Analysis, different
clustering methods, Linear Discriminate Analysis, Linear Regression Method. The
main principle of the program is to make every step of data analysis clear,
understandable and visually represented.
The program
was used successfully in several projects concerning data analysis. You can
learn much more about this from the following links:
![]() GORBAN Alexander N., ZINOVYEV
Andrey Yu. : Visualization of Data by Method of Elastic Maps and Its
Applications in Genomics, Economics and Sociology (PS, PDF)
GORBAN Alexander N., ZINOVYEV
Andrey Yu. : Visualization of Data by Method of Elastic Maps and Its
Applications in Genomics, Economics and Sociology (PS, PDF)
![]() ZINOVYEV Andrey Yu. : Visualization
of Multidimensional Data (in Russian) ( HTML
).
ZINOVYEV Andrey Yu. : Visualization
of Multidimensional Data (in Russian) ( HTML
).
You can
download current version of ViDaExpert here. It will work under
Windows'95'98'NT4'2000. The program is free for non-commercial use.
You can
learn more about using ViDaExpert from the following presentations:
![]() VIDAEXPERT OVERVIEW ( PDF)
VIDAEXPERT OVERVIEW ( PDF)
![]() VIDAEXPERT: CREATING DATASET ( PDF)
VIDAEXPERT: CREATING DATASET ( PDF)
![]() VIDAEXPERT: DATASET VISUALIZATION (
PDF)
VIDAEXPERT: DATASET VISUALIZATION (
PDF)
![]() VIDAEXPERT: DATA ANALYSIS (
PDF)
VIDAEXPERT: DATA ANALYSIS (
PDF)
Here you can download packet with examples of
datatable, dataset and map files for Iris database.
To work
with standard data tables in dBase (*.dbf) and Paradox (*.db) formats, you will
need to install Borland DataBase Engine version 5.0 or later.
Feel free
to contact the authors of the program: Andrey
Zinovyev and Alexander
Pitenko.